Energy Consumption and Efficiency in Electronic Devices

With the rapid advancement of technology, the number of electronic devices used in our homes and workplaces has significantly increased. This rise has led to higher energy consumption and growing environmental impacts. In this context, making conscious choices regarding the energy consumption and efficiency of electronic products is essential, both economically and environmentally.
Energy efficiency refers to the ability of a device to perform its function while consuming the least possible amount of energy. It allows the same level of performance with lower energy usage, reducing energy waste. Energy efficiency plays a critical role in lowering carbon emissions, decreasing energy costs, and promoting the sustainable use of energy resources.
Electronic devices are categorized according to their energy efficiency using various labeling systems. In the European Union, energy labels grade devices from A (most efficient) to G (least efficient), helping consumers make informed decisions about energy performance.
Additionally, the ENERGY STAR label identifies products that meet specific energy efficiency standards. This label enables consumers to easily recognize energy-saving products.
Energy Consumption of Electronic Devices in Türkiye
In Türkiye, household energy consumption has been increasing with the widespread use of electronic devices. In 2022, the total final energy consumption of households reached 1,287,738 terajoules. A significant portion of this consumption came from electrical appliances and electronic devices.
According to data from the Ministry of Energy and Natural Resources, Türkiye’s electricity consumption increased by 3.8% in 2024 compared to the previous year, reaching 347.9 TWh. The growing number of electronic devices in homes significantly contributes to this rise.
Electricity consumption in Europe has been steadily declining over the past 15 years. Events such as the 2008 financial crisis, the COVID-19 pandemic, and the recent energy crisis have all contributed to this trend. However, the rising energy demand of data centers could increase Europe’s electricity demand by up to 30%.
In 2022, over 41% of Europe’s electricity came from renewable sources—a significant step forward for energy efficiency and sustainability.
In 2020, 3.3 billion tech devices in U.S. households consumed approximately 176 terawatt-hours (TWh) of electricity. This accounted for 12% of residential energy use and 4.5% of the nation’s total electricity consumption. Transitioning to energy-efficient devices could reduce household energy use by 25% to 30%.

Benefits of Choosing Energy-Efficient Electronic Products
1. Economic Savings
Energy-efficient devices use less electricity, leading to significant reductions in energy bills. For example, ENERGY STAR-certified devices can consume 10% to 50% less energy than standard models.
2. Reducing Environmental Impact
Lower energy consumption leads to reduced use of fossil fuels and lower carbon emissions, making it an essential part of the fight against climate change.
3. Sustainable Use of Energy Resources
Energy efficiency ensures the optimal use of existing energy resources, enhances energy security, and reduces dependence on energy imports.
Labels and Indicators to Watch for When Buying Electronics
When purchasing electronic products, it is important to look for the following labels and indicators:
• Energy Label (A–G Scale): Shows the energy efficiency of the device. A-rated products are the most efficient, while G-rated ones are the least.
• ENERGY STAR Label: Marks products that meet specific energy-saving criteria.
• Energy Consumption Value (kWh): Indicates the annual energy consumption in kilowatt-hours, helping estimate yearly energy costs.
The energy efficiency of electronic devices is crucial for both individual savings and environmental sustainability. Energy labels and classification systems allow consumers to make informed choices. By opting for energy-efficient products, we can reduce energy costs and minimize environmental impact.

Television Viewing Habits in Turkey and the World

Over the past two decades, screen-based media consumption has become one of the most transformative elements of modern life, affecting individuals across every age, culture, and demographic. From traditional television to digital streaming platforms, the nature of what we watch, how often we watch, and why we watch has changed dramatically. This shift has been driven by a complex interplay of technological, psychological, sociological, and cultural factors. In this article, we examine the trends in screen viewing habits in Turkey and across the globe over the last 20 years, using verifiable statistical data, while also offering a forward-looking simulation for the next 5, 10, and 20 years.
In Turkey, the average daily screen time per person in 2025 has reached 7 hours and 24 minutes. This marks an increase of 16 minutes compared to 2024 and reflects a broader upward trajectory seen consistently over the past two decades. Younger generations, particularly Gen Z—those born between 1997 and 2012—are reported to spend approximately 9 hours a day in front of screens. In contrast, individuals over the age of 55 tend to exhibit significantly lower screen times. Educational background also plays a role: individuals with lower levels of formal education generally consume more television content than their more highly educated counterparts. When considering content preferences in Turkey, television series and daytime talk shows dominate the landscape, especially among middle-aged and older audiences. Children and adolescents, meanwhile, are increasingly influenced by both traditional television and digital media content, with primary school-aged viewers being among the most affected.
Television Watching Time in the World
Globally, the average daily screen time in 2025 stands at approximately 6 hours and 40 minutes. However, these averages vary significantly by region. South Africa currently holds the highest average screen time at 9 hours and 24 minutes per day, while Japan records the lowest with just 3 hours and 56 minutes. Turkey ranks among the top countries in terms of total screen consumption, consistent with broader patterns of increasing digital media engagement. Age again proves to be a critical factor. Gen Z globally mirrors Turkey’s pattern, logging around 9 hours of screen time daily. Even among toddlers, screen exposure is becoming increasingly common: nearly half of children aged 0 to 2 have regular interactions with smartphones, a fact that has prompted growing concern among educators and health professionals.
The reasons behind this increase in screen time are multifaceted. Psychologically, excessive screen use—especially among children aged 2 to 17—has been associated with reduced emotional stability, lower curiosity, and diminished self-regulation. Such effects raise long-term concerns regarding mental health and social development. On a sociological level, increasing digitalization has gradually replaced traditional forms of human interaction. The COVID-19 pandemic only accelerated this shift, pushing many social, educational, and professional interactions onto screens and creating new routines of extended media use. Culturally, the massive growth in content variety and the on-demand nature of streaming platforms have reshaped how people engage with media. Individuals can now access highly personalized content libraries from virtually anywhere, eliminating many of the time and space limitations that once regulated television viewing. Finally, technological advancements—particularly the widespread adoption of smartphones and tablets—have made screen-based entertainment more accessible than ever before. These devices serve as constant companions, integrating screen time into every aspect of daily life.
Estimated Television Viewing Projection for the Coming Years Based on Current Data
Looking toward the future, current data allows us to construct projections about how screen time may evolve over the next several decades. In Turkey, average daily screen time is expected to reach approximately 7 hours and 45 minutes by 2030. By 2035, this figure may increase to 8 hours and 15 minutes, and by 2045, it could surpass 9 hours and 30 minutes. On a global scale, similar trends are anticipated. Average screen time worldwide could climb to around 7 hours and 15 minutes in the next five years, 8 hours and 30 minutes in a decade, and potentially exceed 10 hours and 30 minutes within 20 years. These projections are based on current trends in technology adoption, digital media consumption patterns, and demographic behaviors.
In conclusion, the last 20 years have witnessed a profound transformation in screen viewing habits, both in Turkey and around the world. This evolution reflects not just changes in technology, but also deeper shifts in how people live, work, learn, and connect. As we move forward, it will be crucial for societies to balance the benefits of screen-based media—such as access to information, entertainment, and connection—with the psychological and social risks it may pose. Understanding these dynamics is essential not only for policy makers and educators, but for families and individuals seeking to navigate an increasingly screen-saturated world.

Satellite-Based Mobile Systems Must Be Prepared for Communication During Disasters

To ensure uninterrupted communication during disasters, satellite-connected mobile communication systems should be made ready. These systems can provide network connectivity to mobile phones by offering direct satellite service.

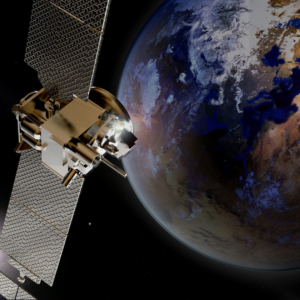
Low Earth Orbit (LEO) satellites provide the broadband internet service required for communication. These systems serve as a complement to existing mobile networks. With the help of these satellites, next-generation mobile devices can receive direct service. In situations where mobile networks are insufficient, these systems can step in to maintain communication or take on a complementary role.

In large-scale disasters like earthquakes, terrestrial infrastructure may be damaged or may collapse due to heavy usage. In such cases, satellite systems facilitate reliable and instant communication connections, making it easier for emergency response teams and aid workers to coordinate. They also prevent affected individuals from losing contact with their families and loved ones.

The low Earth orbit satellite communication systems developed in recent years provide an unparalleled solution for disaster situations. Thanks to technological advancements in this field after 2010, the capacity and performance of geostationary satellites that provide backhaul for cellular networks or coverage for remote areas have increased. This development also makes it possible to meet the needs of commercial internet services and machine-to-machine communications.

In addition to base stations, direct connections to mobile devices can be provided via these satellites. This technology is known internationally as “Direct to Device (D2D)” communication. This system transmits data from the ground directly to mobile phones via LEO satellites and offers uninterrupted communication anywhere through broadband internet. With its wide coverage area, this technology is of critical importance during disasters.

This system should be set up and activated immediately without delay. Many people may think about the cost. However, it should be noted that in some countries where this system is used, the cost of sending an SMS is only 1 USD. This is not a high price in terms of accessibility at any time. It is a service that should be accepted without hesitation during disaster situations.

The Role of VSAT in Disaster Recovery

Communication is crucial during an earthquake, and the ability to transmit communication without cables can only be achieved through satellite technologies. The VSAT (Very Small Aperture Terminal) system, which provides continuous broadband satellite internet service, refers to small (80 cm) antenna-based satellite ground stations. VSAT is a system that enables two-way satellite internet communication between geographically distant locations through a “central ground station” (Hub station).
TUYAD’s Role in Disaster Situations
TUYAD provides training for the installation and activation of these systems during AFED (Acil Felaket ve Afet Durumu – Emergency Disaster and Emergency Situation), storing the details of trained individuals in a CRM system, and calling on these individuals for duty when needed.
VSAT systems play a crucial role in communication during disaster recovery and emergency response. Given that it is impossible to predict when and where an earthquake or disaster will occur, most of the time, these events quickly disable infrastructure. Those living in the affected area, as well as those wishing to provide assistance, will turn to mobile devices for communication. However, when infrastructure is damaged, communication becomes impossible.
In these situations, VSAT technology is the key to maintaining communication. Satellites serving the region are critical here. For Turkey, TÜRKSAT and Eutelsat satellites are among the easiest sources of VSAT services.
TÜRKSAT KU and KA band VSAT systems keep a sufficient stock of terminals for emergency communications during disasters. These terminals are deployed by volunteer installation teams, ready to be activated across Turkey.
The Importance of Quick Communication Setup During Emergencies
In a disaster scenario, the ability to establish connections as quickly as possible is truly a matter of life and death. Ensuring that disaster response teams and the general public can quickly establish communication is vital.
VSAT installation training is offered by TUYAD to anyone across Turkey who wishes to participate. Since it is impossible to predict when and where an earthquake will occur, all trained individuals are called to duty during such events. This work is carried out on a voluntary basis, and we extend our gratitude to all the volunteers who have contributed to communication services during emergencies.
The installation of these systems is critical for establishing communication in places where help is needed, both during and before/after the rescue efforts.
The Need for Assistance in the Field During a Disaster
In disaster situations, field teams will constantly need additional personnel. Furthermore, the accessibility of these teams is of great importance. In such cases, priority should be given to VSAT installation teams.
The role of VSAT terminals in emergency communication during disasters became crystal clear during the most recent earthquake. The activation of these systems, through TUYAD’s VSAT group integration, and the rapid deployment of registered personnel in the affected regions enabled communication to be re-established.
Communication Saves Lives
During an earthquake, communication is the most important factor in saving lives. VSAT is the only means of establishing communication in an affected region where the infrastructure has been damaged.
VSAT installation teams may have to travel long distances and face challenging conditions to reach the disaster zone, carrying sensitive equipment. Upon arrival, they work to set up and activate the equipment, often without any prior communication infrastructure in place.
VSAT deployment teams, having received specialized training, require only electrical power (typically supplied by generators) to operate. By racing against time, they install the VSAT antenna, make the necessary precise adjustments, and quickly connect to the internet, making a significant impact on disaster recovery efforts.
The Importance of Training and Certification
During a disaster, all satellite operators reserve their entire capacity for use in the affected regions. Equipment is stocked, but the critical aspect is the installation and activation process, which is only possible with trained human resources. We would like to extend our heartfelt thanks to all VSAT installers for their dedication during disaster situations.
TUYAD’s free volunteer installation training programs and the certification obtained afterward provide participants with valuable knowledge and skills about satellite operations and equipment. This not only makes them experts in satellite communication during emergencies but also prepares them for everyday satellite operations. In disaster recovery, the priority is always to save lives.
Conclusion and Gratitude
VSAT systems are of paramount importance for communication during earthquakes and other disasters. Rescue teams are working with incredible dedication to save people as quickly as possible from the affected areas. As TUYAD, we thank all the volunteers who contributed to emergency efforts and inform you that we will continue our volunteer installation training programs.

DVB-T and DVB-T2 Technologies: Overview, Global and National Applications, Advantages, Disadvantages, and Infrastructure Requirements

  1. What Are DVB-T and DVB-T2 Technologies?

DVB-T (Digital Video Broadcasting — Terrestrial) is a technology developed for terrestrial digital television broadcasting. It was standardized by ETSI (European Telecommunications Standards Institute) in 1997. Compared to analog broadcasting, DVB-T offers higher quality video and audio with more efficient spectrum usage. It supports SD (Standard Definition) and HD (High Definition) broadcasting using MPEG-2 and later MPEG-4 compression formats.

DVB-T2 (Digital Video Broadcasting — Second Generation Terrestrial) is the enhanced second-generation version of DVB-T. Introduced in 2009, DVB-T2 provides higher data transmission capacity, improved error correction techniques (LDPC and BCH), better compatibility with mobile devices, and supports UHD (Ultra High Definition) content. It offers up to 50% more spectral efficiency compared to DVB-T.

  1. How Is It Used?

Broadcasts using DVB-T or DVB-T2 are transmitted over terrestrial transmitters via antennas. To receive these signals, users need:

  • A TV that supports DVB-T or DVB-T2,
  • Or a set-top box (STB) compatible with DVB-T2,
  • And a terrestrial antenna.

DVB-T2 is not backward compatible with DVB-T. This means a DVB-T-only device cannot receive DVB-T2 broadcasts.

  1. Global Adoption of DVB-T2 Technology

DVB-T2 is currently deployed in over 70 countries across Europe, Asia, and Africa. Some examples include:

  • United Kingdom: The first country to implement DVB-T2. Trial broadcasts began in 2009, and it officially launched in 2010 via the Freeview HD platform.
  • Germany: Transitioned to DVB-T2 HD broadcasting in 2017, using HEVC (H.265) encoding for high-quality HD content.
  • Sweden: The first Nordic country to adopt DVB-T2 in 2010, with trial UHD broadcasts conducted later.
  • Poland: Completed its transition to DVB-T2 in 2022.
  • Thailand: First Southeast Asian country to adopt DVB-T2, launching nationwide broadcasts in 2014.
  • Africa: Countries like Kenya, Nigeria, Uganda, and Namibia have implemented DVB-T2 for both free and paid television services.

In some regions, DVB-T2 is also used for mobile TV and portable devices. Its increased bandwidth supports UHD (4K) broadcasting.

  1. DVB-T2 Usage in Turkey

Turkey adopted DVB-T2 as its national digital broadcasting standard in 2012. Trial broadcasts began in 2013 in Ankara through TRT and KULE A.Ş., including 2 HD and 5 SD channels transmitted via a 27 Mbps multiplex. However, large-scale implementation has remained limited due to several factors:

Reasons for Limited Adoption:

  1. Legal and Regulatory Challenges:
    The broadcasting license tenders conducted by RTÜK in 2013 for national, regional, and local broadcasters were annulled due to legal disputes filed by some broadcasters. This stalled the national transition to digital terrestrial broadcasting.
  2. Lack of Infrastructure:
    DVB-T2 requires significant investments in new transmitter stations and infrastructure compatible with Single Frequency Networks (SFN), which are not yet fully established.
  3. Limited Consumer Equipment Compatibility:
    Many televisions in Turkey only support DVB-T and not DVB-T2. This forces consumers to purchase additional set-top boxes, posing a financial burden.
  4. Widespread Satellite Broadcasting:
    The majority of TV viewers in Turkey receive broadcasts via satellite. This reduces the demand for terrestrial broadcasting, limiting its attractiveness for investment.
  1. Advantages and Disadvantages of DVB-T2

Advantages:

  • High Capacity: Delivers up to 50% more data than DVB-T.
  • HD/UHD Support: Suitable for 4K and future broadcasting standards.
  • Efficient Spectrum Use: Enables more channels within fewer frequencies.
  • Advanced Error Correction: Improves signal reliability and quality.
  • Multiple Services: Supports TV, radio, and data broadcasting on the same frequency.
  • Mobile Compatibility: Allows for seamless reception on mobile devices.

Disadvantages:

  • High Transition Costs: Requires significant investment from both broadcasters and consumers.
  • Lack of Backward Compatibility: DVB-T2 signals are not supported by DVB-T-only receivers.
  • Legal and Bureaucratic Barriers: Successful implementation depends on cohesive regulation and cross-institutional cooperation.
  1. Necessary Steps and Infrastructure for DVB-T2 Implementation in Turkey

To successfully implement DVB-T2 nationwide, Turkey needs to undertake the following actions:

  1. Re-launch the Licensing Process:
    RTÜK must revisit and update the previously annulled licensing process and complete it transparently and efficiently.
  2. Establish a National Transmission Network:
    Organizations like TRT and KULE A.Ş. should build a countrywide transmission infrastructure with SFN-compatible towers.
  3. Frequencies and Spectrum Planning:
    Frequencies, especially in the UHF band, must be reallocated and planned specifically for DVB-T2 broadcasts.
  4. Public Awareness and Incentives:
    Consumers should be educated about DVB-T2, and financial support programs (e.g., subsidized set-top boxes) should be introduced for low-income groups.
  5. Receiver Equipment Policies:
    TVs sold in Turkey should be required to support DVB-T2 or carry clear labeling to inform consumers.
  6. Broadcaster Incentives:
    Regional and local broadcasters should be offered technical and financial assistance to transition to DVB-T2.

DVB-T2 is a modern broadcasting technology offering superior quality, better spectrum efficiency, and multi-service flexibility. Many countries have successfully adopted it, benefiting both broadcasters and consumers. In Turkey, although DVB-T2 has been officially adopted and tested, its implementation has been hindered by legal, financial, and infrastructural challenges. With the right legal reforms, infrastructure investments, and public awareness efforts, Turkey can fully embrace the potential of DVB-T2 and modernize its broadcasting ecosystem. With its perspective of creating awareness in technological steps to be taken, TUYAD Telecommunication Satellite and Broadcasting Business People Association has always served the sector and assumed responsibility for the necessary work. For detailed information on the subject, you can reach TUYAD at info@tuyad.org.


TÜBİTAK Support Consultancy !

TÜBİTAK plays a significant role in Turkey’s research, development, and commercialization ecosystem, offering various support programs, particularly for SMEs and entrepreneurs. These programs encourage businesses to develop innovative projects and commercialize them. As Hedef Koç Consulting, we provide comprehensive consultancy services for institutions and entrepreneurs who wish to apply for TÜBİTAK support programs. Our services are structured around the following strategic steps:

  1. Free Analysis and Needs Assessment

At the first point of contact, we analyze the information you provide regarding your planned activities. Based on this, we identify the most suitable TÜBİTAK support programs and present you with a detailed analysis report. This report is completely free and helps you identify the best financial support options for your planned projects.

  1. Strategic Planning and Roadmap

After reviewing the free analysis report, we work together to create a detailed work, time, and personnel plan for the chosen support program. Utilizing our experience, we define the steps for the application process and prepare a roadmap. We ensure that every stage is planned together, enabling a successful application.

  1. Preparation of Project and Incentive Files

Once the planning phase is complete, we prepare the project and incentive files required for the application. These files are created in full compliance with regulations, ensuring quality and speed. We remove any bureaucratic barriers to ensure your application is completed as quickly as possible.

  1. Process Tracking and Legal Procedures

After the application, we meticulously track the legal and bureaucratic processes related to your projects. We keep you updated on every step and ensure the proper management of the application process, aiming for a positive outcome.

  1. Post-Approval Support for Grants and Incentives

Once your application is approved, we manage the process of transferring grants and incentives to your business. Our goal is to ensure that the support is provided to you on time and correctly. Additionally, we handle all procedures related to the utilization of the incentives on your behalf.

  1. Reporting and Closure Process

At the end of the implementation phase, we prepare periodic reports on the project and incentive programs and share them on time with the relevant authorities and you. The process is closed in compliance with all rules and regulations.

TÜBİTAK offers several support programs, especially for SMEs. One of the most popular of these is the 1507 TÜBİTAK SME R&D Start-up Support Program. This program provides significant support for R&D projects of SMEs, offering up to 75% grant funding for the projects. The application process involves determining the project budget, followed by the approval of the application and providing various forms of support to the business. Additionally, the projects are required to be monitored for a specific period, and the results need to be reported. TÜBİTAK also offers special guidance services to SMEs throughout the application process.

Another important support program is the 1501 Industrial R&D Support Program, aimed at encouraging industrial businesses to engage in R&D activities. Under this program, businesses are supported in developing new products and processes, thereby improving their international competitiveness.

Additionally, the 1512 Technogirişim Capital Support Program allows entrepreneurs to realize their technology-focused projects. This program provides seed capital to entrepreneurs, helping turn innovative business ideas into viable commercial products.

TÜBİTAK offers a wide range of support, and the application process is quite detailed. At Hedef Koç Consulting, we guide businesses through every step of this process. Our goal is to ensure that you benefit from TÜBİTAK’s support programs in the most efficient way possible and help your projects reach successful outcomes.


Customs Tariffs Applied to Turkey in the Home Electronics Sector

TUYAD Telecommunications Satellite and Broadcasting Business People Association has been providing guidance on necessary issues with the services it has provided to its members and regulatory bodies in the sector it represents for nearly 30 years.

In today’s global trade environment, current data and statistics are always guiding in planning the strategic steps to be taken in our country, which is increasing its export volume every day.

The tax rates applied to home electronics products exported from Türkiye vary depending on the customs tariffs and trade agreements of the recipient countries. The import tax applied by each country may differ depending on the type of product, country of origin and trade agreements.

Below is information on general customs tax rates and practices in some countries importing home electronics products from Türkiye:

  1. European Union (EU)

Since the European Union countries have a Customs Union agreement with Turkey, imports from Türkiye are subject to the EU’s Common Customs Tariff. In this case, home electronics products are usually subject to customs duties at the following rates:

  • Televisions and sound systems: 0% customs duty (as it is part of the Customs Union).
  • Smartphones: Many countries within the EU do not charge customs duties for smartphones coming from Türkiye.
  • White goods (refrigerators, washing machines, etc.): Usually 0% customs duty.

However, EU countries charge Value Added Tax (VAT) on products. This rate varies by country:

  • Germany: 19% VAT
  • France: 20% VAT
  • Italy: 22% VAT
  1. United States (US)

The US is a country that does not have a free trade agreement with Turkey. Therefore, home electronics products coming from Türkiye are subject to the customs tariffs set by the US:

  • Smartphones: 0% customs duty (mostly), but higher rates may apply for certain devices with certain features.
  • Televisions: Average customs duty of 2.5%.
  • Other electronics (white goods, etc.): Customs duties typically range from 2.5% to 3%.

In the US, not all imports are subject to VAT (or sales tax); however, states may impose their own sales taxes.

  1. Russia

Since Russia has no Customs Union agreement with Turkey, it imposes its own tariffs. Home electronics products from Türkiye are generally subject to the following rates in Russia:

  • Televisions: 10% customs duty.
  • Smartphones: 5% customs duty.
  • Home appliances: 10% customs duty.

In addition, VAT is charged to all imports in Russia, which is 20%.

  1. China

China imposes specific customs duties on products from Türkiye. The tax rates in China for home electronics are as follows:

  • Smartphones: 0% customs duty (in some cases, up to 5%).
  • Televisions: 10% customs duty.
  • Home appliances: 10% customs duty.

Value Added Tax (VAT) is also applied to imported products in China. This rate is 13%.

  1. Japan

Japan is a country that does not have a free trade agreement with Turkey. In Japan, home electronics products coming from Türkiye are subject to the following customs duty rates:

  • Smartphones: 0% customs duty.
  • Televisions: 0% customs duty.
  • White goods: 2.5% – 5% customs duty.

VAT is also applied to imported products in Japan and this rate is 10%.

  1. Middle Eastern Countries (Saudi Arabia, United Arab Emirates, etc.)

In Middle Eastern countries, the following customs duty rates are generally applied to home electronics products coming from Türkiye:

  • Saudi Arabia: An average of 5% customs duty is applied to home electronics products.
  • United Arab Emirates: 5% customs duty.
  • Qatar: 5% customs duty.

VAT rates are also generally 5% in these countries.

In countries importing home electronics products from Türkiye, customs duty rates vary depending on the country’s trade policies, trade agreements and the type of product. In general, in EU countries, low or zero customs duty is applied to products due to the Customs Union agreement with Turkey, while in the USA, Russia and some Asian countries, customs duties may be higher. In the global trade market, countries’ taxation policies may vary depending on various strategies. As TUYAD, we continue to access up-to-date data periodically and share this general information with our sector representatives. These sources contain basic information and import and export duties vary depending on the type of product, country of origin and current legislation. You can reach us at info@hedefkoc.com for special legislation information requested for products and/or services.

AN ASSESSMENT OF THE GLOBAL AND DOMESTIC ECONOMIC IMPACTS OF THE U.S. NEW TARIFF POLICY!

An Assessment of the Global and Domestic Economic Impacts of the U.S. New Tariff Policy

On April 2, 2025, U.S. President Donald Trump announced significant changes in tariff rates applied to trade with countries around the world. This decision, which marks a major shift in longstanding trade policies, is expected to reshape global trade balances and impact domestic economic policies aimed at supporting U.S. industry and reducing the trade deficit. The decision brings both opportunities and risks at the global level, as well as for Turkey.

At a press conference on April 2, 2025, the Trump administration declared a minimum tariff rate of 10% on imports. In addition, higher reciprocal tariffs were set for certain countries to address trade imbalances—34% for China, 20% for the European Union, and 46% for Vietnam, among others. Sector-specific measures, such as a 25% tariff on imported automobiles, were also introduced. These measures are intended to revitalize domestic industry and reduce the U.S. trade deficit .

Global Significance of the Policy

Positive Aspects

  • Domestic Production Incentives: The policy is designed to support U.S. domestic production by imposing high tariff barriers, thereby boosting employment.
  • Reduction of Trade Deficit: By applying reciprocal tariffs, the administration aims to narrow the trade deficit.
  • Foundation for Negotiations: The president’s openness to negotiations with other countries may pave the way for resolving trade disputes in the future.

Negative Aspects

  • Risk of Global Trade Wars: High tariffs can provoke tensions in international trade and potentially spark trade wars.
  • Market Volatility: The policy is likely to trigger sudden fluctuations in global stock and currency markets, increasing overall economic uncertainty.
  • Supply Chain Disruptions: The adjustments could lead to a restructuring of global supply chains and shifts in production locations .

Implications for China

As the world’s production hub, China is likely to face significant challenges in the U.S. market due to the imposition of a 34% tariff. This could result in:

  • Increased Costs: Products imported from China may become significantly more expensive, putting Chinese exporters at a disadvantage.
  • Supply Chain Shifts: U.S. companies might seek alternative suppliers to mitigate cost increases.
  • Political and Economic Pressure: The tariffs could serve as a lever in international negotiations, increasing pressure on China both economically and politically .

Potential Advantages for Turkey

Turkey benefits from a low tariff rate of 10% under the new U.S. tariff scheme, which can yield several advantages:

Competitive Edge

  • Low Tax Burden: With a tariff rate considerably lower than those imposed on competitors such as China (34%), Vietnam (46%), and the EU (20%), Turkish products become more competitively priced in the U.S. market.
  • Price Competitiveness: In sectors like automotive, textiles, and machinery, the lower tariffs help Turkish exporters maintain cost advantages, enhancing their competitiveness in the U.S. market.

Attraction of Foreign Investment

  • Relocation of Production Facilities: Due to the U.S. tax update on high-tech products and advanced production processes, countries seeking to lower their costs are increasingly looking to Turkey. In addition, Turkey’s attractive investment incentives make it a desirable location for establishing production facilities. As highlighted by Sanayi ve Teknoloji Bakanı Mehmet Fatih Kacır in the HIT-30 High Technology Investment Program, long-term financing, tax reductions, and comprehensive incentive packages are designed to transform Turkey into a major hub for high-tech production.
  • Incentives and Support: Foreign investors can benefit from Turkey’s robust incentive framework, which includes exemptions from VAT, customs duty waivers, corporate tax reductions, and social security premium support. These incentives are provided via the e-TUYS system and are further enhanced by regional investment support measures.

Economic Stability and Growth

  • Increasing Export Volume: Data from 2024 indicates that Turkey’s trade volume with the U.S. has been on the rise. The new tariff policy could further consolidate this growth, helping Turkey reach its target of a $100 billion trade volume.
  • Sectoral Development: In sectors such as automotive, textiles, and machinery, the combination of low tariffs and attractive investment incentives is expected to drive production growth and create new employment opportunities.

Turkey’s Strategic Advantages and Foreign Investment Incentives in the Global Economy

Turkey is an attractive destination for global investors due to its strategic location, skilled labor force, robust logistics infrastructure, and competitive production costs. The growing interest in high-tech production in Turkey is driven by two main factors:

  1. U.S. Tax Updates: The higher tariff rates imposed by the U.S. on competitors increase production costs in those countries, while Turkey’s 10% rate offers a cost advantage for manufacturing high-tech products.
  2. Comprehensive Investment Incentives: Turkey offers a wide range of incentives under its General, Regional, Strategic, and Project-Based Investment Incentive programs. These incentives cover VAT exemptions, customs duty waivers, corporate tax reductions, social security premium support, favorable interest rates, and even land allocation and infrastructure support. Foreign investors can obtain an Investment Incentive Certificate through the e-TUYS system, ensuring they receive these benefits.

Sanayi ve Teknoloji Bakanı Mehmet Fatih Kacır’s HIT-30 program exemplifies this approach by providing long-term financing, tax incentives, and grant support for high-tech, R&D-focused investments. These measures are key to Turkey’s strategic plan to significantly boost high-tech exports and production by 2030.

Moreover, reports from the Central Bank of the Republic of Turkey confirm that these incentive policies have been well received by investors, contributing to increased direct foreign investment. Turkey’s geographical proximity, cultural affinity, and transparent legal system further enhance its appeal as a secure and attractive investment destination.

Will Other Countries Establish Production Facilities in Turkey?

Globally, firms seeking to optimize production costs might opt for locations with lower tax burdens. Turkey’s:

  • Strategic Location,
  • Skilled Workforce,
  • Strong Logistics and Trade Infrastructure,
  • Attractive Investment Incentives

make it a compelling choice for foreign investors looking to establish manufacturing facilities. Proximity to U.S., European, and Asian markets, combined with post-investment support and incentive packages, positions Turkey as an alternative production hub within global supply chains.

President Trump’s tariff announcement on April 2, 2025, is aimed at strengthening U.S. domestic markets by boosting local production and reducing the trade deficit, but it also brings significant risks such as global trade tensions and supply chain disruptions.

  • Positive Aspects: U.S. efforts to support domestic production and the potential for renegotiation pave the way for trade policy adjustments, while Turkey’s low tariff rate and comprehensive investment incentives offer strong prospects both globally and domestically.
  • Negative Aspects: High tariffs in other countries may trigger trade wars and market volatility, affecting global supply chains.

For Turkey, the combination of a low 10% tariff rate and state-supported incentive packages not only provides a competitive edge in the U.S. market but also positions the country as a prime location for high-tech production. These factors are likely to encourage foreign investors to set up manufacturing facilities in Turkey, reinforcing long-term economic growth and technological transformation.


Smiling Curve: Distribution of Added Value and Strategic Management

The Smiling Curve is a graphical model that illustrates how added value is distributed across different stages in the process of bringing a product or service to market. First introduced by Acer Inc.’s founder, Stan Shih, in the early 1990s, this concept demonstrates that more value is created at both ends of the value chain, while the middle section generates less. The Smiling Curve is widely used as an analytical tool, especially in industries such as technology, electronics, automotive, and fashion.

Smiling Curve Theory and Core Arguments

The Smiling Curve theory challenges the traditional belief that production processes generate the highest added value. According to this model, a product’s life cycle consists of the following stages:

  1. Research and Development (R&D) and Design: This stage involves the creation of innovative ideas, prototyping, and patenting, all of which contribute to high added value.
  2. Manufacturing: This is the stage where the product is physically produced. However, due to the outsourcing of production to low-cost countries, the added value in this process tends to be lower.
  3. Marketing, Distribution, and After-Sales Services: Activities such as brand management, advertising, and customer support occur in this phase and typically generate high added value.

When the three stages are plotted on a graph with added value on the vertical axis and production stages on the horizontal axis, the curve’s two endpoints are high, while the middle section is lower. This results in a shape resembling a smile.

The Smiling Curve theory is supported by various studies examining how added value is distributed in global value chains. For example, Meng Bo’s 2020 study, “Measuring Smile Curves in Global Value Chains,” shows that since 2001, developing countries—particularly China—have contributed significantly to the overall increase in added value. These findings highlight major shifts in global value creation and trade dynamics.

Understanding and Interpreting the Smiling Curve Graph

A Smiling Curve graph typically consists of the following elements:

  • Vertical Axis: Level of Added Value
  • Horizontal Axis: Production Stages
  • Left End: Research, Development, and Design activities (R&D, Design)
  • Middle Section: Manufacturing and Assembly
  • Right End: Marketing, Distribution, and After-Sales Services

The key interpretations of the graph include:

  • High-Value Stages: The two endpoints of the curve indicate activities with high profit margins and advantages based on intellectual property.
  • Low-Value Stages: The middle section represents manufacturing, which typically relies on low-cost labor and results in lower profit margins.
  • Curve Depth: The deeper the curve, the less value manufacturing contributes, increasing the gap between R&D and marketing.

Application Areas and Industry Use Cases

The Smiling Curve concept is widely applied in the following industries:

  • Technology and Electronics: Companies in the computer, semiconductor, and smartphone sectors heavily invest in R&D and brand management.
  • Automotive: High-value areas include R&D (e.g., new engine technologies and electric vehicles) and after-sales services (e.g., maintenance and spare parts).
  • Fashion and Retail: Luxury brands invest in design and brand value while outsourcing production to low-cost countries.
  • Pharmaceuticals and Biotechnology: Drug development and marketing create high added value, whereas mass production contributes relatively less.

Conclusion and Strategic Management Recommendations

The Smiling Curve model helps businesses make more informed strategic decisions. To gain a competitive advantage, companies should focus on the following areas:

  1. Investing in High-Value Areas: Allocating more resources to R&D, design, and brand management can drive sustainable growth.
  2. Avoiding Low-Value Production: Outsourcing manufacturing to lower-cost countries can create cost advantages.
  3. Enhancing After-Sales Services: Investing in customer support can increase customer loyalty and generate higher profit margins.

In conclusion, the Smiling Curve is a powerful model for understanding value creation processes and enhancing competitive advantages. However, its application varies across industries, making it crucial to tailor strategies accordingly.


Product or Service Pricing Intelligence Research and Pricing Consultancy by Industry

In today’s competitive market conditions, developing the right pricing strategy is a critical factor that directly impacts a company’s profitability and competitive strength. Hedef Koç Consulting provides professional consultancy services by conducting sector-specific product and service pricing intelligence research to help businesses develop the most effective pricing strategies.

Scope of Our Services

  1. Pricing Intelligence Research
    • Analysis of price trends in the target market
    • Examination of competitor pricing strategies
    • Regional and international price comparisons
    • Dynamic pricing models and trends
  2. Strategic Pricing Consultancy
    • Determining the optimal price for products or services
    • Customer segmentation and analysis of price perception
    • Cost-based, competitive, and value-based pricing methods
    • Demand and elasticity analyses for profitability optimization
  3. Pricing Optimization Based on Market Dynamics
    • Impact of economic variables on pricing
    • Seasonal and periodic price adjustments
    • Analysis of promotion and discount policies
    • Pricing strategies in digital markets

Why Choose Hedef Koç Consulting?

  • Data-Driven and Analytical Approach: We conduct detailed market data analysis to strengthen your decision-making processes.
  • Customized Industry-Specific Solutions: We recognize that each sector and business has unique pricing dynamics and develop tailored strategies accordingly.
  • Strategies That Provide a Competitive Advantage: We create the best market positioning through competitor analysis.
  • Long-Term Profitability and Growth-Oriented Solutions: We offer comprehensive solutions that shape not only current but also future pricing strategies.

Who Can Benefit?

  • Businesses looking to optimize their product or service pricing
  • Companies seeking to develop competitive pricing strategies
  • Organizations wanting to track price changes in the market
  • Manufacturers and suppliers looking to update their pricing policies
  • Enterprises aiming to increase profitability through strategic pricing

Hedef Koç Consulting helps businesses develop the most effective pricing strategies to achieve sustainable growth goals. Contact us to strengthen your competitive advantage and increase your profitability!